'%20fill='%23fff'%3e%3cpath%20d='M24%20364.337V24h141.909c25.481%200%2046.833%203.601%2064.056%2010.803%2017.222%207.191%2030.183%2017.279%2038.882%2030.24s13.049%2027.972%2013.049%2045.041c0%2012.961-2.72%2024.513-8.148%2034.645-5.429%2010.142-12.906%2018.534-22.431%2025.174-9.526%206.651-20.548%2011.299-33.069%2013.953v3.325c13.732.661%2026.451%204.383%2038.134%2011.134%2011.684%206.762%2021.077%2016.155%2028.168%2028.17%207.092%2012.025%2010.638%2026.231%2010.638%2042.628%200%2018.281-4.647%2034.601-13.952%2048.939-9.305%2014.35-22.762%2025.648-40.381%2033.908-17.607%208.248-38.992%2012.377-64.143%2012.377H24zm82.258-200.414h45.534c8.975%200%2016.947-1.497%2023.929-4.493s12.432-7.312%2016.374-12.961c3.931-5.65%205.902-12.466%205.902-20.439%200-11.409-4.041-20.384-12.135-26.926-8.082-6.53-18.995-9.801-32.738-9.801h-46.866v74.62zm0%20134.109h50.853c17.839%200%2030.987-3.381%2039.466-10.131%208.479-6.762%2012.708-16.178%2012.708-28.247%200-8.755-2.049-16.309-6.145-22.686-4.096-6.365-9.922-11.298-17.443-14.789-7.532-3.491-16.561-5.231-27.089-5.231h-52.339v81.095l-.011-.011zM388.865%2024v340.337h-81.256V24h81.256zm181.618%20230.159V109.082h81.091v255.255h-77.435v-47.529h-2.665c-5.649%2015.616-15.263%2028.004-28.829%2037.145-13.578%209.14-29.941%2013.71-49.102%2013.71-17.398%200-32.683-3.986-45.864-11.97-13.181-7.973-23.433-19.14-30.745-33.489s-11.023-31.165-11.133-50.437V109.082h81.256v146.739c.11%2013.854%203.766%2024.767%2010.968%2032.74s17.002%2011.96%2029.413%2011.96c8.082%200%2015.372-1.795%2021.847-5.407%206.486-3.601%2011.628-8.865%2015.45-15.781%203.821-6.927%205.737-15.318%205.737-25.174h.011zm224.376%20115.002c-26.704%200-49.718-5.286-69.044-15.869-19.337-10.583-34.181-25.703-44.532-45.371-10.362-19.668-15.537-43.069-15.537-70.215s5.208-49.445%2015.614-69.212c10.418-19.779%2025.096-35.174%2044.037-46.197s41.261-16.53%2066.962-16.53c18.17%200%2034.787%202.83%2049.851%208.48s28.08%2014.007%2039.048%2025.086%2019.501%2024.734%2025.591%2040.966%209.14%2034.81%209.14%2055.756v20.273H694.145v-47.199h146.226c-.11-8.633-2.159-16.342-6.145-23.104s-9.448-12.047-16.374-15.869-14.866-5.726-23.841-5.726-17.233%202.015-24.424%206.057c-7.202%204.052-12.906%209.537-17.112%2016.452-4.207%206.927-6.431%2014.757-6.652%2023.512v48.025c0%2010.417%202.049%2019.525%206.145%2027.332s9.911%2013.876%2017.454%2018.193c7.532%204.317%2016.506%206.486%2026.924%206.486%207.201%200%2013.731-1.002%2019.612-2.995%205.869-1.993%2010.912-4.923%2015.119-8.81%204.206-3.876%207.367-8.645%209.47-14.294l74.616%202.158c-3.105%2016.728-9.889%2031.264-20.361%2043.62s-24.182%2021.937-41.129%2028.743c-16.947%206.816-36.559%2010.219-58.825%2010.219l.011.033z'/%3e%3c/g%3e%3cdefs%3e%3cclipPath%20id='A'%3e%3cpath%20fill='%23fff'%20transform='translate(24%2024)'%20d='M0%200h892v345.161H0z'/%3e%3c/clipPath%3e%3c/defs%3e%3c/svg%3e)
Building Our Own Frontend Cache
Designing a high performance three-tier caching system for Blue.
The TanStack Query documentation describes caching as “possibly the hardest thing to do in programming.” Their overview page lists the challenges anyone building a data layer has to solve:
- Deduplicating multiple requests for the same data into a single request
- Updating “out of date” data in the background
- Knowing when data is “out of date”
- Reflecting updates to data as quickly as possible
- Performance optimizations like pagination and lazy loading
- Managing memory and garbage collection of server state
- Memoizing query results with structural sharing
They’re right. And if you’re building a platform where a single workspace can hold over 100,000 records — each with custom fields, tags, assignees, checklists, and comments — the list gets longer:
- Loading data in phases so users can interact before everything arrives
- Persisting cache across browser sessions for instant reloads
- Moving heavy processing off the main thread so the UI doesn’t freeze
- Normalizing entities so a tag rename doesn’t require updating thousands of records
- Supporting optimistic mutations with rollback on failure
- Delta fetching to avoid re-downloading data that hasn’t changed
- Powering client-side search, filtering, and duplicate detection from the cache
Most teams would reach for an existing library. We tried. It wasn’t enough.
Why not use an existing library
When we started rewriting Blue’s frontend from Vue 2 to Vue 3 in late 2025, the first thing we needed to rethink was data fetching. The old app used Apollo Client for GraphQL, and while Apollo is a powerful library, we found ourselves fighting it more than embracing it. Too much magic. Too many implicit behaviors. When things went wrong, debugging meant diving into layers of abstraction we didn’t control.
We evaluated URQL as a lighter alternative. It was promising — simpler API, better developer experience. But when we benchmarked its normalized cache against our data, the normalization at our scale was janky. Off-the-shelf normalizers weren’t built for that volume.
We studied the source code of both libraries to understand their caching patterns, extracted the best ideas, and built a cache tailored to our exact data shape and access patterns. The result is a three-tier caching system — Pinia hot cache, IndexedDB cold cache, and a Web Worker network layer — that makes workspace switching instant and enabled us to kill our search infrastructure entirely.
The three-tier architecture
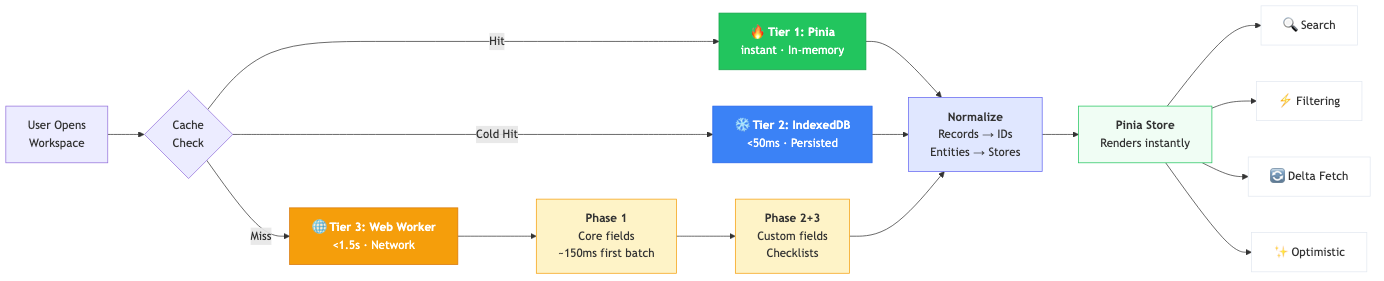
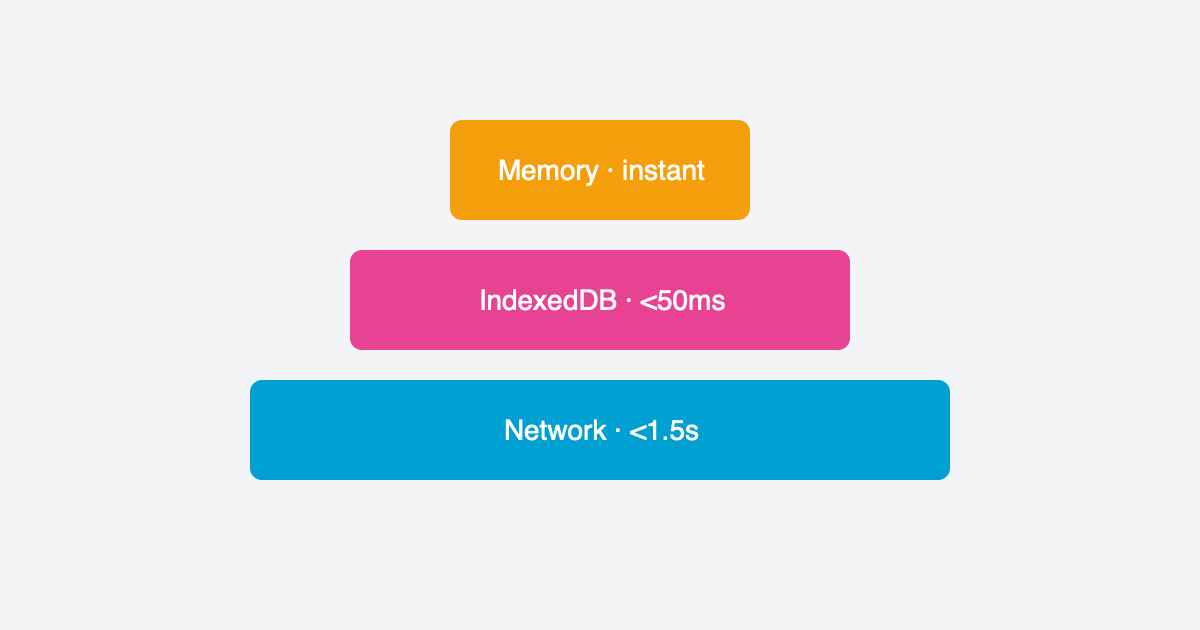
Our caching system has three layers, each optimized for a different scenario:
Tier 1: Pinia hot cache (instant). When you switch between workspaces within the app, records load instantly from an in-memory Map. No network request, no IndexedDB read — just a pointer change to the active workspace’s data. This is the path for 90% of navigation.
Tier 2: IndexedDB cold cache (<50ms). When you hard-refresh the browser or come back hours later, records are hydrated from IndexedDB into the Pinia store. The UI renders in under 100ms — while a background refresh fetches fresh data from the server and silently reconciles any changes.
Tier 3: Network via Web Worker (<1.5s). On first visit to a workspace with no cache, a dedicated Web Worker fetches everything from the API using parallel batched requests. The worker handles all the heavy lifting — fetching, normalization, entity extraction — off the main thread, so the UI stays responsive throughout.
The 100ms target for cached loads was a deliberate design goal from the start. We wanted Blue to feel like a native app, not a web app. And we’re building toward a full offline experience where the cold cache isn’t just a performance optimization — it’s the primary data source.
Three-phase loading
Not all data is equally urgent. A record’s title, position, and assignees are needed immediately to render a board or list view. Custom field values and checklists can wait a beat.
We designed this upfront based on profiling the old app. Custom fields were the bottleneck — they account for 80-90% of payload size but aren’t needed for the initial render.
Phase 1 fetches core record fields only: id, title, status, position, assignees, tags, dates. The first batch of 25 records arrives in ~150ms, so the UI has something to show almost immediately. The remaining records stream in parallel. For a workspace with 1,000 records, Phase 1 completes in about 1.5 seconds.
Phase 2 enriches records with custom field values, lookups, and computed fields. This runs in the background — the user is already scrolling and clicking.
Phase 3 loads checklists and checklist items. Phases 2 and 3 run in parallel since they have no dependencies on each other.
The user can interact with the workspace as soon as Phase 1 completes. Everything else fills in seamlessly behind the scenes.
Normalization
Every record that comes from the API contains embedded objects — full user objects for assignees, full tag objects, full list objects. If you store records as-is, you end up with the same user duplicated across hundreds of records. A tag rename means updating every record that references it. Memory usage balloons.
Before — embedded objects:
// Record A
{
  "id": "rec_1",
  "title": "Fix login bug",
  "assignees": [
    { "id": "u1", "name": "Alice", "avatar": "...", "role": "..." },
    { "id": "u2", "name": "Bob", "avatar": "...", "role": "..." }
  ],
  "tags": [{ "id": "t1", "name": "Urgent", "color": "#ef4444" }],
  "list": { "id": "l1", "name": "To Do", "color": "#3b82f6" }
}

// Record B — Alice, Urgent tag, and To Do list all duplicated
{
  "id": "rec_2",
  "title": "Update docs",
  "assignees": [
    { "id": "u1", "name": "Alice", "avatar": "...", "role": "..." }
  ],
  "tags": [
    { "id": "t1", "name": "Urgent", "color": "#ef4444" },
    { "id": "t2", "name": "Review", "color": "#f59e0b" }
  ],
  "list": { "id": "l1", "name": "To Do", "color": "#3b82f6" }
}
After — normalized with IDs only:
// Records store only IDs — ~50KB for 1,000 records (vs ~100KB embedded)
{ "id": "rec_1", "title": "Fix login bug", "assigneeIds": ["u1", "u2"], "tagIds": ["t1"], "listId": "l1" }
{ "id": "rec_2", "title": "Update docs", "assigneeIds": ["u1"], "tagIds": ["t1", "t2"], "listId": "l1" }

// Entity stores — each object stored once
usersStore:  { "u1": { "name": "Alice", ... }, "u2": { "name": "Bob", ... } }
tagsStore:   { "t1": { "name": "Urgent", ... }, "t2": { "name": "Review", ... } }
listsStore:  { "l1": { "name": "To Do", ... } }
The difference matters at scale. Rename “Urgent” to “Critical”? Update one entry in tagsStore — instantly reflected across every record that references it. No iteration, no patching, no missed updates.
This normalization happens entirely in the Web Worker, so the main thread never has to process raw API responses.
The self-DDoS incident
When we first built the worker, we benchmarked different parallelism levels and found that 32 concurrent requests gave us the best throughput. The system was blazingly fast in testing.
Then we put a banner on the old Vue 2 app encouraging users to try the new version. Thousands of users clicked it. Each one spawned a Web Worker firing 32 parallel requests at our API.
We DDoS’d ourselves.
We quickly dialed the parallelism back to 4-8 concurrent requests depending on workspace size. Still fast. Much less likely to take down our own servers. A humbling reminder that benchmarks on a single machine don’t reflect what happens when your entire user base hits the endpoint at once.
Delta fetching
Once the initial dataset is cached, subsequent visits don’t need to re-fetch everything. We modified our API to track the last change timestamp for any action on any record. On return visits, the client sends its last sync timestamp and the API returns only records that changed since then.
Every 10th fetch does a full refresh to prevent drift. The rest are deltas — typically returning a handful of changed records instead of thousands.
This dramatically reduced both API load and bandwidth. For users who check Blue throughout the day, most workspace loads transfer almost no data. The cache is already warm; the delta confirms nothing changed.
What the cache unlocked
The most surprising part of building a custom cache wasn’t the performance — it was what it enabled us to build on top of it.
Client-side search. We had been running Meilisearch for full-text search across workspaces. With hundreds of gigabytes of data, keeping the search index in sync was unreliable, and maintaining a separate search service was complexity we didn’t need. Once every workspace’s records lived in the cache, we moved search entirely to the frontend — a dedicated Fuse.js worker indexes records from the cache and returns results in milliseconds. We killed Meilisearch and haven’t looked back.
Duplicate detection. When a user creates a new record, we compare its title against every other record in the workspace — entirely on the client. If there’s a close match, we warn them before they create a duplicate. This runs in real-time as they type, powered by the cache.
Instant filtering and views. Every view in Blue — board, list, calendar, Gantt — is filtered, sorted, and grouped entirely on the frontend. Changing a filter doesn’t hit the API. Switching between saved views is instantaneous. This is only possible because the full dataset lives in memory.
Optimistic updates. Because we own the cache layer, we added a full optimistic mutation system — create, update, delete, and bulk operations with automatic rollback on error. When you drag a card on a board, the UI updates in the same frame. The API call happens in the background. If it fails, the card rolls back. This was added after the initial cache was built, once we realized how much better the UX could be.
The hard parts
Caching is one of the two hard problems in computer science for a reason.
Cache invalidation is the obvious one. When do you show stale data? When do you force a refresh? Our approach — stale-while-revalidate with reconciliation — works well, but getting the reconciliation right was tricky. Deleted records need to disappear from the cache when the server says they’re gone, but not before. We track detailed reconciliation stats (records before, after, stale count, duration) to monitor this in production.
Race conditions are the subtle killer. What happens when a user rapidly switches between three workspaces? Or double-clicks a workspace while it’s loading? Or the browser tab goes to sleep and wakes up mid-fetch? We ended up with lock mechanisms, deduplication guards, and careful handling of worker lifecycle to prevent duplicate loads and stale data from leaking into the wrong workspace.
Web Worker communication has its own overhead. Structured cloning of large datasets between the worker and main thread isn’t free. We batch messages and stream results as they arrive rather than waiting for everything to finish. This is why the first 25 records appear in ~150ms even though the full dataset takes seconds.
Was it worth it
Without question.
Workspaces with thousands of records load in under 2 seconds on first visit and instantly on subsequent visits. Users can interact while data loads in the background. Hard refreshes feel like no-ops. Every filter, sort, and search operation happens in milliseconds because it never hits the network.
We also eliminated an entire piece of infrastructure (Meilisearch), reduced our API load substantially through delta fetching, and unlocked features like duplicate detection that wouldn’t be practical with a server-round-trip model.
This also sets up nicely in the future for full offline support.
The TanStack docs aren’t wrong — building your own cache is a significant undertaking. But for a product where data loading performance is the experience, owning that layer gives you control that no library can match.
— Manny